The Burndown Chart has many benefits. It is one of the main metrics tools in Scrum for several reasons. It’s easy to create, scale and read. However, it also has drawbacks that make it not a universal tool. In today’s article, we cover the topic of disadvantages and advantages of the Burndown Chart.
Advantages and disadvantages of the Burndown Chart – table of contents:
Introduction
We have written about what it is, how to create and interpret a Burndown Chart in previous articles. Today we will focus on the advantages and disadvantages of the Burndown Chartt. However, most of them are not hidden in the simple graph itself. Rather, they are related to the ways of using the Burndown Chart to motivate the Development Team, as they describe the results of their work and strengthen self-organization.
Advantages of the Burndown Chart
The Burndown Chart allows you to visualize the progress of your project. Its readability and simplicity make it so popular. That’s why it’s a good idea for the Burndown Chart to be not only a constantly updated metric hidden in a digital project management tool. If at all possible, it’s worth making it a reference point for the Development Team visible in the physical workplace. Whether in the form of an on-screen visualization or a hand-drawn sketch.
It motivates the Development Team
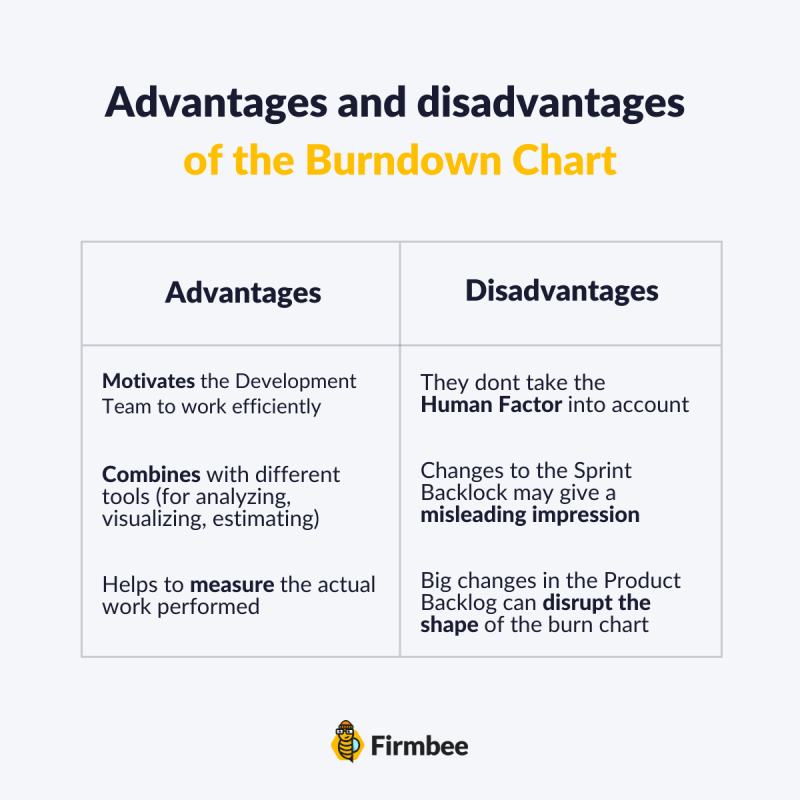
The transparency of the Burndown Chart can make it a tool to motivate the Development Team to work efficiently. Reaching the “zero” point in each Sprint can become an ambitious goal of the Team, for which rewards are given – according to the principles of business gamification.
The visibility of an up-to-date and interestingly maintained Burndown Chart can also enhance a spirit of cooperation and self-organization. After all, the metric is a measure of teamwork. It doesn’t show exactly who did – or didn’t – complete the planned tasks, only the results achieved.
It measures the actual work performed
Developers decide how many tasks they will perform in a given Sprint. The more experienced the Team is, the more accurately they should predict their actions. And the bur-down chart reflects the real progress of the Sprint.
Thus, the advantage of the Burndown Chart is not so much to measure the objective amount of work done, but the ratio of planned-to-completed tasks. Thus, Developers gradually learn how to plan them and can estimate their capabilities more and more accurately and eliminate repetitive errors.
It couples with other tools
One of the significant advantages of theBurndown Chart concerns its versatility in combining with other tools. The following tools can apply to:
- analyzing the work of the Development Team
- visualizing the progress of work on the Product
- estimating the project budget
For example, in the latter case, the use of the Project Scale Burndown Chart allows for a comparison of the planned and actual budget for the entire project.

Disadvantages of the Burndown Chart
Despite all the advantages of the Burndown Chart outlined above, it can become a source of confusion for the Development Team. However, what we frequently call the “flaws” of the Burndown Chart are not due to imperfections of the tool itself. The problems outlined below concern the way of implementing the Burndown Chart rather than its design. Below are the flaws that can interfere with depicting the progress of the Development Team in this way.
“The Human Factor”
Charts cannot be an absolute measure of a team’s progress. They are just tools to apply in different, more or less skillful ways. We can consider it as a disadvantage (or advantage) not only of the Burndown Chart but also of other measures of team performance.
To create a Burndown Chart, you need other people to enter data. In other words, the Developers put down task completion time on the chart. They might have lengthened or shortened it a bit – either through inattention or wanting to make things better for the team. Developers also sometimes forget to log their time. Or leave the timer on. This causes the working time to extend to several hours. And after discovering the mistake, it is difficult to reconstruct its real course.
Changes to the Sprint Backlog
Sprint Backlog should not be modified after the start of a Sprint. However, in practice, such changes occur quite often. They result from changing requirements of Stakeholders. Or unforeseen problems that Developers encounter.
This causes the Burndown Chart to be scaled. This is because the time taken to complete the tasks remains the same. However, the scale of tasks remaining increases. This may give a misleading impression that the Development Team has incorrectly planned the work to do in a given Sprint. Or that it works too slowly.
Changes to the Sprint Backlog can also result from tasks that were scheduled for completion too quickly. In such a situation, the Development Team usually decides to increase the number of tasks. This in turn may result in not completing them on time. Also, conflicts may arise from the overlap of remaining tasks from the previous Sprint with new tasks scheduled to be completed by Stakeholders and Product Owners.
Changes to the Product Backlog
Big changes in the Product Backlog can disrupt the shape of the Burndown Chart. And thus strongly falsify the picture of work progress and Team effectiveness. This happens when new User Stories appear. And those which are close to the implementation phase are often broken into smaller parts. It also happens that the Client resigns from some Product functionalities.
Therefore, when interpreting the Burndown Chart, one must be guided by knowledge and experience in evaluating the Team’s performance. And also take into account the variability of the Backlog. If the chart is not the only metric used to evaluate performance, the other charts will allow you to see a more complete picture of the progress of the work.
Summary
The Burndown Chart can significantly contribute to the motivation of the Development Team. This is because it provides a measure of the real work done on the plan. Moreover, its combination with other metric tools can be a source of valuable knowledge about the Team’s work and Product planning.
By carefully applying Scrum principles, you can avoid potential problems with the Burndown Chart. The most important thing is to adapt the tools of keeping the chart following the actual Scrum Team’s work, as well as to minimize changes to the Sprint and Product Backlog, which we write more about in this article.
If you like our content, join our busy bees community on Facebook, Twitter, LinkedIn, Instagram, YouTube, Pinterest.
Author: Caroline Becker
As a Project Manager, Caroline is an expert in finding new methods to design the best workflows and optimize processes. Her organizational skills and ability to work under time pressure make her the best person to turn complicated projects into reality.
Scrum Guide:
- Glossary of basic terms, roles and notions
- What is Scrum?
- Scrum values
- How to implement Scrum in your company?
- Scrum Team - what is it and how does it work?
- Who is a Product Owner?
- The most common mistakes of Product Owner
- Who is the Scrum Master?
- Characteristics of a good Scrum Master
- The most common mistakes of Scrum Master
- What statistics and metrics should the Scrum Master track?
- Cooperation between Product Owner and Scrum Master
- Development Team in Scrum
- The most common mistakes of Developers
- Scrum artifacts
- Scaling Scrum
- Sprint Backlog
- What is the Product Backlog?
- What are User Stories?
- Creating the best User Story with INVEST
- The most common User Story mistakes
- User Story Acceptance Criteria
- Estimation and Story Points in Scrum
- Planning Poker
- Team Estimation Game
- Defining Increment
- Scrum events
- What is Sprint in Scrum?
- Scrum Team Commitments - Product Goal, Sprint Goal and Definition of Completion
- What is a Burndown Chart?
- How to create and interpret a burndown chart?
- Advantages and disadvantages of the burndown chart
- Kanban boards in Scrum and Scrumban
- Velocity in Scrum - Speed of the Development Team
- Daily Scrum
- Sprint Planning
- Sprint Review
- What is a Sprint Retrospective?
- Common mistakes during a Sprint Retrospective
- Product Backlog nurturing

