Infographics make it possible to present content attractively on the Internet. Well designed infographics will catch the user’s eye much more effectively than text alone. If you notice that your content goes unnoticed by your audience, it’s a sign that you should prepare it in a more visually attractive form. But how to create an infographic?
Creating an infographic is not complicated and does not require knowledge of specialized software, but it will help you generate valuable traffic. How to achieve it?
How to create an infographic? – Table of contents:
- Infographics – what are they?
- How to create an infographic?
- Extract headers
- Canva – a free program to create infographics
- Online infographics in Visme
- Summary
Infographics – what are they?
The idea of infographics is based on the graphic form of presenting the information. The main idea is to prepare content in such a way that is clear and accessible to the user. Appropriate data visualization not only has a positive influence on better digestibility, but also its attractiveness. The human brain is definitely better influenced by images than by dry blocks of text.
Now that you know what an infographic is – here are some tips to help you learn the basic principles of design. We also point out the tools in which you will prepare an eye-catching infographic.
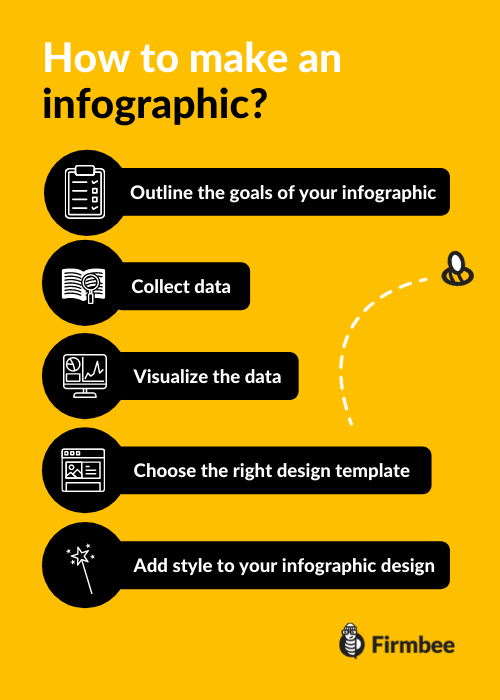
How to create an infographic?
The starting point is to collect the data you wish to present to the audience. You can also start by choosing a category that you want to make users aware of, such as:
- presenting statistics or research findings,
- an explanation of a phenomenon or relationship,
- information summary,
- bringing attention to a problem.
Extract headers
Breaking down the information gathered into paragraphs and labeling them with appropriate titles makes it easier for users to navigate and promotes the assimilation of information. It also prompts the developer to prepare visuals that highlight key headings.
Pay attention to the proper saturation of the infographic with content. The universal rule of thumb is that there should be between 200 and 300 words on it. Designs with more text content decrease user interest.
First of all, take care to provide creative comparisons. Instead of writing “you waste about 25 minutes every day scanning or deleting unwanted emails in your mailbox”, it’s better to phrase it “in a month, you waste about 1 day of work going through unwanted emails”. Also, ensure the language you use is consistent and tailored to your target audience.
One popular method is to present numerical data in a visually appealing form. You can also break down the problem into steps that will help you solve it. Framing the steps together with evocative pictograms will amount to easily digestible information. Another form of presenting data is through using clear comparisons. Also, at the beginning of your journey with designing online infographics, it is beneficial to look for inspiration from experienced creators.
Canva – a free program to create infographics
To create engaging and visually appealing infographics, you can use free tools. One of them is Canva – it also comes in a PRO version, but at the beginning, you can successfully use its free functionality.
Canva offers many free templates for creating infographics that you can modify to suit your needs. Changing colors to your company’s, adding logos, inserting thematic icons and illustrations – this is only a fraction of the possibilities of this program. A rich database of various images and the ability to change the format is also a big help – a useful feature when you design graphics for different platforms.
Online infographics in Visme
Easy editing capabilities, a rich source of fonts, icons, and images are the advantages of this online tool. The added value that distinguishes this program is the high degree of interactivity of the prepared projects – there are animated elements to pick and choose from that will additionally attract the users’ eyes.
Summary
Preparing online infographics is a skill that you can acquire on your own based on the tools available on the web. Such graphic designs not only help in engaging the users with the content, but they are also more likely to be shared on social media. This, in turn, is a desirable effect that will allow you to reach a wider audience at a relatively low cost.
Now, since you know how to create an infographic and if you feel that you want to grow in this field, you can specialize in designing illustrations and maybe think about selling them online!
Author: Klaudia Kowalczyk
A graphic & UX Designer which conveys into design what cannot be conveyed in words. For him, every used color, line or font has a meaning. Passionate in graphic and web design.
